The US Census: Political Power & $$
- Oct 24, 2024
- 4 min read
Updated: Feb 2
A headcount of the US determines over $1T in federal aid and political power for the next decade. Here are its insights.

What is it
A Constitutionally mandated poll of everyone in the US conducted once every 10 years.
So What
Payment. Census results determine how over a trillion dollars gets spent. Recipients get free lunch (SNAP), access to early childhood healthcare(CHIP), housing assistance (LIHEAP), and food for low-income pregnant women (WIC)!
Political power. States receive their number of seats in the House of Representatives based on how many people live in their state. This is one big reason why unmitigated immigration may be a political power play rather than a humanitarian action. Show me the incentives, I'll show you the outcomes.
2020 Census in One Word
Texas. Texas received 2 more House seats, a country best, and a ton of money for having the most rural counties with 45.
Are We Growing?
Less than usual. We only grew 7% in the last ten years, our slowest pace in four decades. An oddity in this decade's Census is that there appear to be twenty less White people in the US. Us Whites definitely die off to old age, overdoses, and Florida, but twenty million gone is a red flag. Something's not right.
NPR makes the case that it's all a matter of definitions. Although 20 million less people selected "White Alone" in 2020, there was a 316% increase in multiracial people who identified as partially White. Turns out, people aren't vibing with being "White" and instead opted for a. multiracial category. Let's give them the benefit of the doubt and say they got their 23andMe results back.
Losers
Coastal elites. NYC, LA, SF, and Chicago have the lowest net migration in the country. CA, NY, MI, OH, PA, IL and WV, all lose 1 House seat.
Micro-Data
The Census also includes smaller and more frequent surveys, namely the American Community Survey (ACS). The ACS collects thousands of data points on the well-being of the American life at the neighborhood, county, and state level. It is the most comprehensive, free data source I know.
To visualize where we're giving aid, let's look at incomes across the US. Pockets of inequality literally highlight our issue of regional inequality and structural employment. In fact, much of Biden's Build Back Better legislation targets these exact regions.
Areas covered in the graph below are roughly 100k-200k people. Think a few neighborhoods in a city or entire counties in rural states.
Although you can easily see our pockets of inequality, the map actually masks our poorest region. Against the backdrop of $150k salaries in NYC are Bronx Community Districts 1-11. Literally touching the Upper West and East side are the poorest people in the country. Zoom in and see for yourself.
Immediately, I think of social capital. Connectivity within and between communities is the path to real wealth. Read Bowling Alone.

Income by Race
Asians average the most income. They also have the largest share of overachievers, shown by their fat right tail. Black people have the lowest average income, but the second highest share of high income earners.

Census Problems
The Census first counted Black people as 3/5 a person. Since then, the fight for representation has been an uphill battle, culminating in seminal legislation like The Voting Rights Act which sought to end racial discrimination and intimidation in voting.
A glaring problem today is prison-based gerrymandering. Our 2 million incarcerated Americans are being counted as residing in the region of the prison, not their home. If counties with prisons are predominately white while inmates come from poor and/or non-white areas, prison-baed gerrymandering quite literally steals from communities in need.
Recently, the Supreme Court voted not to include a question of citizenship in the Census. The unprecedented action would likely deter non-citizens from responding, causing an underestimation, yet again, of those who need to be counted.
Honorable Mention
1) Age Pyramids: Babies not Boomers. States want to look themselves in a mirror and see a pyramid. Fat on the bottom and skinny on top. From government's perspective, we want lots of taxpayers and fewer bills to pay.
Notice any weird ones?

2) Morning Commute: Across the US, maybe more so in the West, the morning commute pays off!

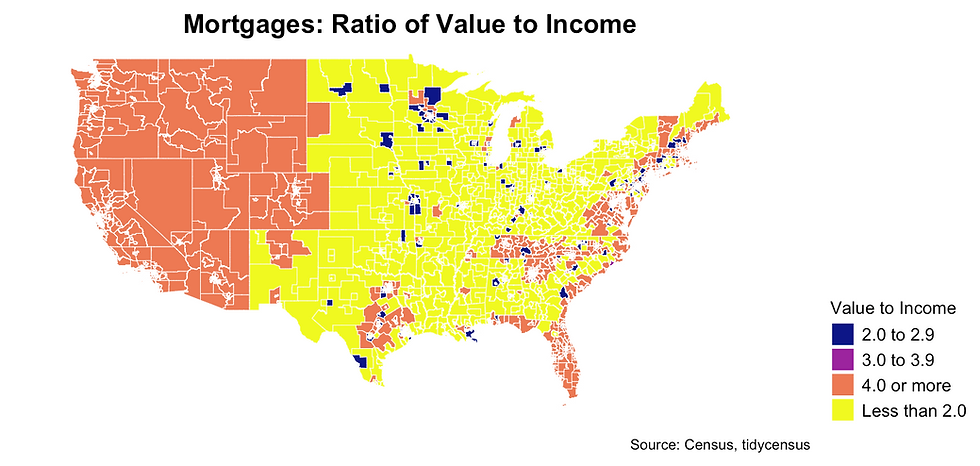
3) Homes. The most important financial asset is more valuable than ever before. Record home valuations can be due in part to shrinking supply but blame must be placed at the feet of government policy of creating new money, artificially inflating value in homes.
The whole west coast has mortgages that are most likely at least 4x their income. Much of the middle of the country has mortgages half as expensive, relatively.